UI Lab
Case Study Patterns
Five options to present case studies without classic cards. Swap in real content as needed.
Timeline Slider
Horizontal panels with challenge → solution → outcome.
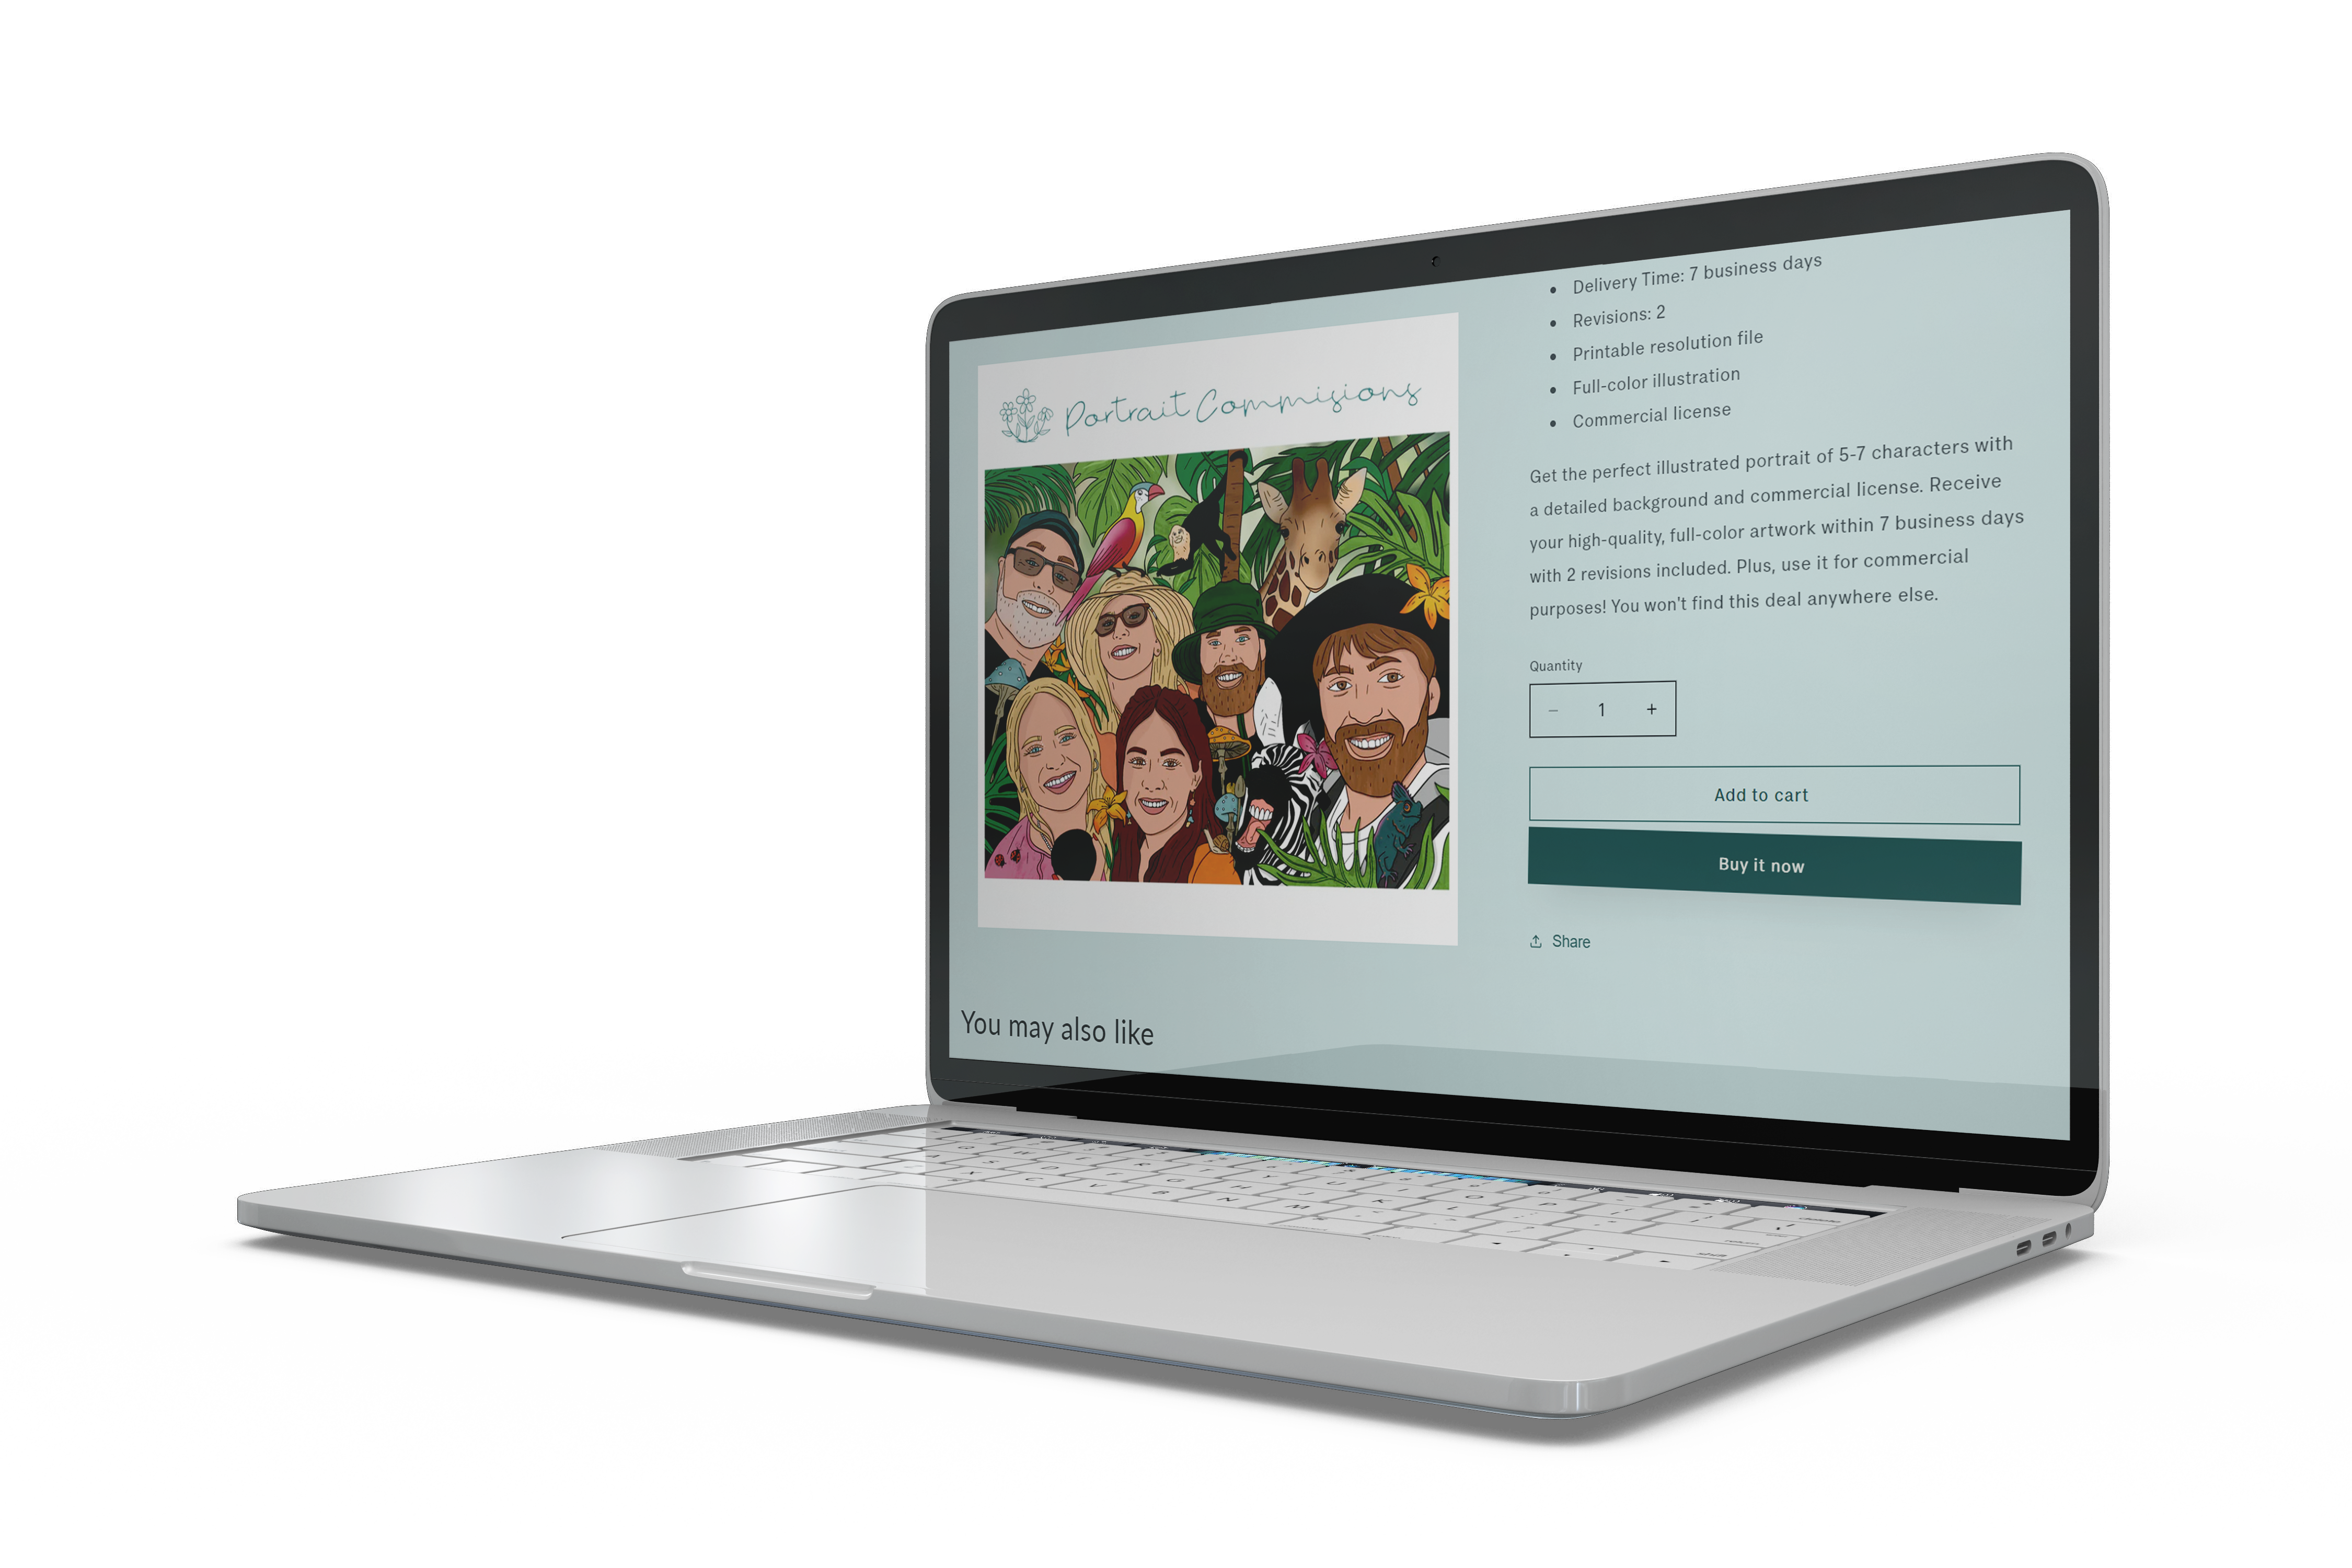
Ecom Revamp
Problem
Low conversion, high bounce.
Solution
Rebuilt PDP and checkout with headless Shopify and CRO tests.
Outcome
+32% conversion, -18% checkout drop-off.

B2B SaaS Dashboard
Problem
Fragmented data and slow reporting.
Solution
Unified dashboard with role-based views and scheduled exports.
Outcome
-40% time-to-report, happier ops teams.

IoT Fleet Monitor
Problem
Limited visibility into on-site equipment.
Solution
Edge ingestion + real-time alerts and mobile control.
Outcome
-25% downtime, proactive maintenance.
Spotlight Rows
Full-width rows, alternating imagery and fact strips.
Case Study
D2C Growth Engine
Conversion-focused redesign with personalized offers.
Case Study
SaaS Analytics
Unified reporting layer and role-based dashboards.
Story + Metrics
Narrative left, stacked metrics right.
Case Study
Platform Modernization
Modernized legacy stack, streamlined flows, and added observability.
Challenge: legacy monolith slowed iteration and lacked visibility.
Approach: modularized services, refreshed UX, and added monitoring.
Outcome: faster deploys, clearer customer journeys, and happier teams.
Impact
Conversion lift
+18%
Support tickets
-22%
Deployment time
-35%
Carousel Overlay
Cover image with overlaid metadata bar; swipe to change.
Retail
Checkout Overhaul
SaaS
Analytics Console
Sticky Scrollytelling
Pinned image with step-by-step text changes.
Case Story
Scrollytelling
Use a pinned image with step-by-step narrative.
Challenge
Disjointed experience causing drop-offs on mobile.

Approach
Rebuilt flows with clearer hierarchy, offline-ready features, and push strategy.

Impact
Higher engagement and smoother releases; set up for future feature launches.

Metric Wall
Grid of impact tiles with a short story strip.
Checkout conversion
+28%
After UX and perf tuning
Bounce rate
-15%
Improved first paint and clarity
Report time
-40%
Consolidated data sources
NPS
+12
Better onboarding and support flows
Quick scan of outcomes with a short narrative. Use this as a top strip before deeper stories.
Before / After
Side-by-side comparison with deltas and key wins.
Before / After
+81% liftBefore
2.1% conversion
- Slow checkout
- Cluttered PDP
- Unclear shipping
After
3.8% conversion
- Streamlined flow
- Clear offers
- Optimized media
Stack of Stories
Accordion/tab style for compact multi-case display.
Challenge → approach → impact details go here. Keep it compact; expand for more.
View caseJourney Map
Phase-based strip showing progress across build stages.
Discovery
Define goals, users, and success metrics.
Design
Flows, prototypes, and validation.
Build
Sprints with demos and QA.
Launch
Go-live, monitoring, and fixes.
Scale
Optimization, new features, and support.
KPI Storyboard
Chapters that spotlight one KPI + mini chart each.
KPI Storyboard
Each chapter spotlights one KPI with a mini visual and quick narrative.
Conversion
+22%
Checkout simplification and offer clarity
Activation
+18%
Onboarding checklist and guided setup
Retention
-12% churnIn-app nudges and better release notes
Quote-first Spotlight
Lead with a strong client quote; strip for the facts.
Quote Spotlight
“Working with Wizard Dev House transformed our product. The team shipped fast and kept quality high.”
Founder, SaaS Co.
Stat + Logo Parade
Compact proof bar with logos and headline metrics.
 +18% conversion
 -12% churn
 +2.1x engagement
 -15% downtime
Filterable Feature
Select by tags to swap the featured story + metrics.
Rebuilt PDP/checkout, optimized media, and ran iterative CRO tests with clear offer framing.